How To Describe Pictures
Images must have text alternatives that describe the information or function represented by them. This ensures that images can be used by people with various disabilities. Appropriate text alternatives depend upon the purpose of the image.
- Informative images: Images that graphically represent concepts and information, typically pictures, photos, and illustrations. The text alternative should be at least a short description conveying the essential information presented by the image.
- Decorative images: Provide a null text alternative (alt=””) when the only purpose of an image is to add visual decoration to the page, rather than to convey information that is important to understanding the page.
- Functional images: The text alternative of an image used as a link or as a button should describe the functionality of the link or button rather than the visual image. Examples of such images are a printer icon to represent the print function or a button to submit a form.
- Images of text: Readable text is sometimes presented within an image. If the image is not a logo, avoid text in images. However, if images of text are used, the text alternative should contain the same words as in the image.
- Complex images: Such as graphs and diagrams: To convey data or detailed information, provide a full-text equivalent of the data or information provided in the image as the text alternative.
- Groups of images: If multiple images convey a single piece of information, the text alternative for one image should convey the information for the entire group.
- Image maps: The text alternative for an image that contains multiple clickable areas should provide an overall context for the set of links. Also, each individually clickable area should have alternative text that describes the purpose or destination of the link.
Using HTML Figures
- Figures are blocks with additional information set off from the main content of the page. Sometimes referenced from the main text.
- They typically contain Lists, Images, Tables, but can also include other content.
- For example, an annual report could reference to a diagram containing the sales volumes of a product.
- The longdesc attribute was intended to provide a reference to the long description page. The value of the
longdesc
attribute of theimg
element would contain the URL of the long description page, NOT the long description text itself. However,longdesc
attribute only works in some screen readers, and it is not part of HTML5. sighted users will not generally be aware that the description page is available, as no browser indicates the presence of thelongdesc
attribute visually, other than through the image context menus. In Firefox, long descriptions linked bylongdesc
are available throughView description
in the image’s context menu. There is an official Chrome Extension that adds long description access in a similar way. Safari has no support forlongdesc
. In other web browsers,longdesc
is currently available only to screen reader users. Mobile platforms currently do not supportlongdesc
. For these reasons, it is recommended thatlongdesc
should not be relied upon to provide access to this long description page.
HTML Figure Example
<p><figure role="group" aria-labelledby="fig-capt">
  <figcaption id="fig-capt">Statistics Canada Poll</figcaption>
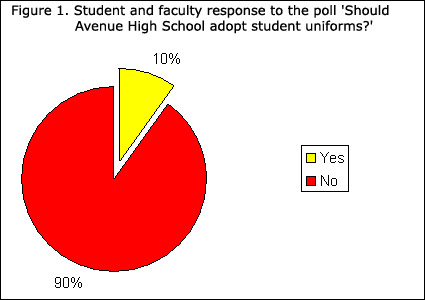
  <img src="https://www150.statcan.gc.ca/n1/edu/power-pouvoir/ch9/img/5214826_01-eng.jpg" title="Figure 1. Student and faculty response to the poll 'Should Avenue High School adopt student uniforms?'" longdesc="longdesc1-StatsCan.shtml#main" alt="Figure 1. Student and faculty response to the poll 'Should Avenue High School adopt student uniforms?'." height=150 width=213 onmouseover=true>
The circle graph/pie chart above clearly shows that 90% of all students and faculty members at Avenue High School do not want to have a uniform dress code and that only 10% of the school population would like to adopt school uniforms. This point is clearly emphasized by its visual separation from the rest of the pie.<br />
<a href="https://www150.statcan.gc.ca/n1/edu/power-pouvoir/ch9/pie-secteurs/5214826-eng.htm">Statistics Canada</a></p>
</figure>
Output

The circle graph/pie chart above clearly shows that 90% of all students and faculty members at Avenue High School do not want to have a uniform dress code and that only 10% of the school population would like to adopt school uniforms. This point is clearly emphasized by its visual separation from the rest of the pie.
Open the following Statistics Canada web page with different browsers, and press the Alt+Enter key when the focus is placed on the image to reveal the Long Description. Some browsers will respond and others will not.
Statistics Canada
Resources
- DAISY: Image Descriptions Coding Examples and HTML Details
- WAI Web Accessibility Tutorials: Images Concepts
- W3C: 11 HTML5 Obsolete features
- WebAIM: Alternative Text
- Longdesc: HTML5 Image Description Extension
- NNELS: Accessible COVID-19 Information with image descriptions
- Alt text that informs: Meeting the needs of people who are blind or low vision, Microsoft AI Research, March 2020
- Alt text that informs: Meeting the needs of people who are blind or low vision, Microsoft AI Research, March 2020
- ABC News: Sonification makes astronomy more inclusive and helps scientists fine-tune celestial observations